The expected rate of decarbonization of the economy is strongly determined by the expected rate of technological progress in lower-polluting energy sources. As discussed in the recent review article by Dugoua and Moscona, technological progress towards greener energy faces a wide range challenges, some unique to green tech but many shared by other technologies. Here, I’m interested in seeing what lessons can be drawn about green-oriented technical change from recent cases of large-scale, technology-driven changes to infrastructure that share many common features with the green transition. In particular, I want to see how well recent experiences match up with the predictions from the directed technical change literature.
I plan to continue to update this, but for now I have looked at the natural gas boom in the 2000s.
To give away the punchline, the natural gas production expansion that started in the late 2000s in the US does seem to match model predictions well. Exuberant expectations of natural gas prices, newly created markets for natural gas, and sustained public and private research funding over decades all were essential contributors to the dramatic increase in gas production from previously “unconventional” sources.
Theory on the direction of technical change
In canonical directed technical change models in economics, growth in a sector is driven by research effort directed toward that sector, and research effort is in turn driven by the profits that researchers can receive from innovating in the sector. Acemoglu et al. (2012) models innovation in a “clean” and “dirty” energy input. Equation 17 from the paper summarizes the forces that affect profits for researchers in the clean, \(c\), or dirty, \(d\), sector. \(\frac{\Pi_{ct}}{\Pi_{dt}} = \frac{\eta_c}{\eta_d}\times\left(\frac{p_{ct}}{p_{dt}}\right)^{\frac{1}{1-\alpha}}\times \frac{L_{ct}}{L_{dt}}\times\frac{A_{ct-1}}{A_{dt-1}}\) These incentives are
- \(\eta\): Relative productivity of innovation in the sectors (how much productivity changes each time a scientist successfully innovates)
- \(p\): the price you can sell the clean or dirty input for
- \(L\): the market size for the input or the number of people you can sell the input to (think about the size of the market of people demanding electric vs internal combustion engine vehicles)
- \(A\): the baseline productivity of each technology or the “standing on the shoulders of giants” effect
Basically, there are effects that come from how much you can sell the product for (second term), how much of the product you can sell (third term), and how productive the innovation process is (the first and last terms). There will be growth in a sector if one or all of these factors tilt sufficiently far toward that sector.
This model abstracts from a couple details behind the factors that will turn out to be important when connecting the model to reality. First, research is forward-looking (researchers are making bets on what will pay off), so expectations of relative prices and relative market size are important for determining where researcher attention flows.
Second, as discussed in detail in Dugoua and Moscona, the framework abstracts from the many steps in the middle of the research process that involve demonstration, scaling up, and otherwise making new technology marketable. This matters especially when evaluating the price and market size effects on one hand and the research productivity effects on the other. The price and market size effects have to do with how much revenue can be generated by selling the good after it is marketable. The research productivity terms are more about what happens during the research process. In my discussion below, I will focus on expectations of prices and market size around the time when investment in operationalizing new technology was occurring. In the discussion of research productivity effects, I will focus on longer-term data on the development of the knowledge base around new technology.
Case study: Natural gas production
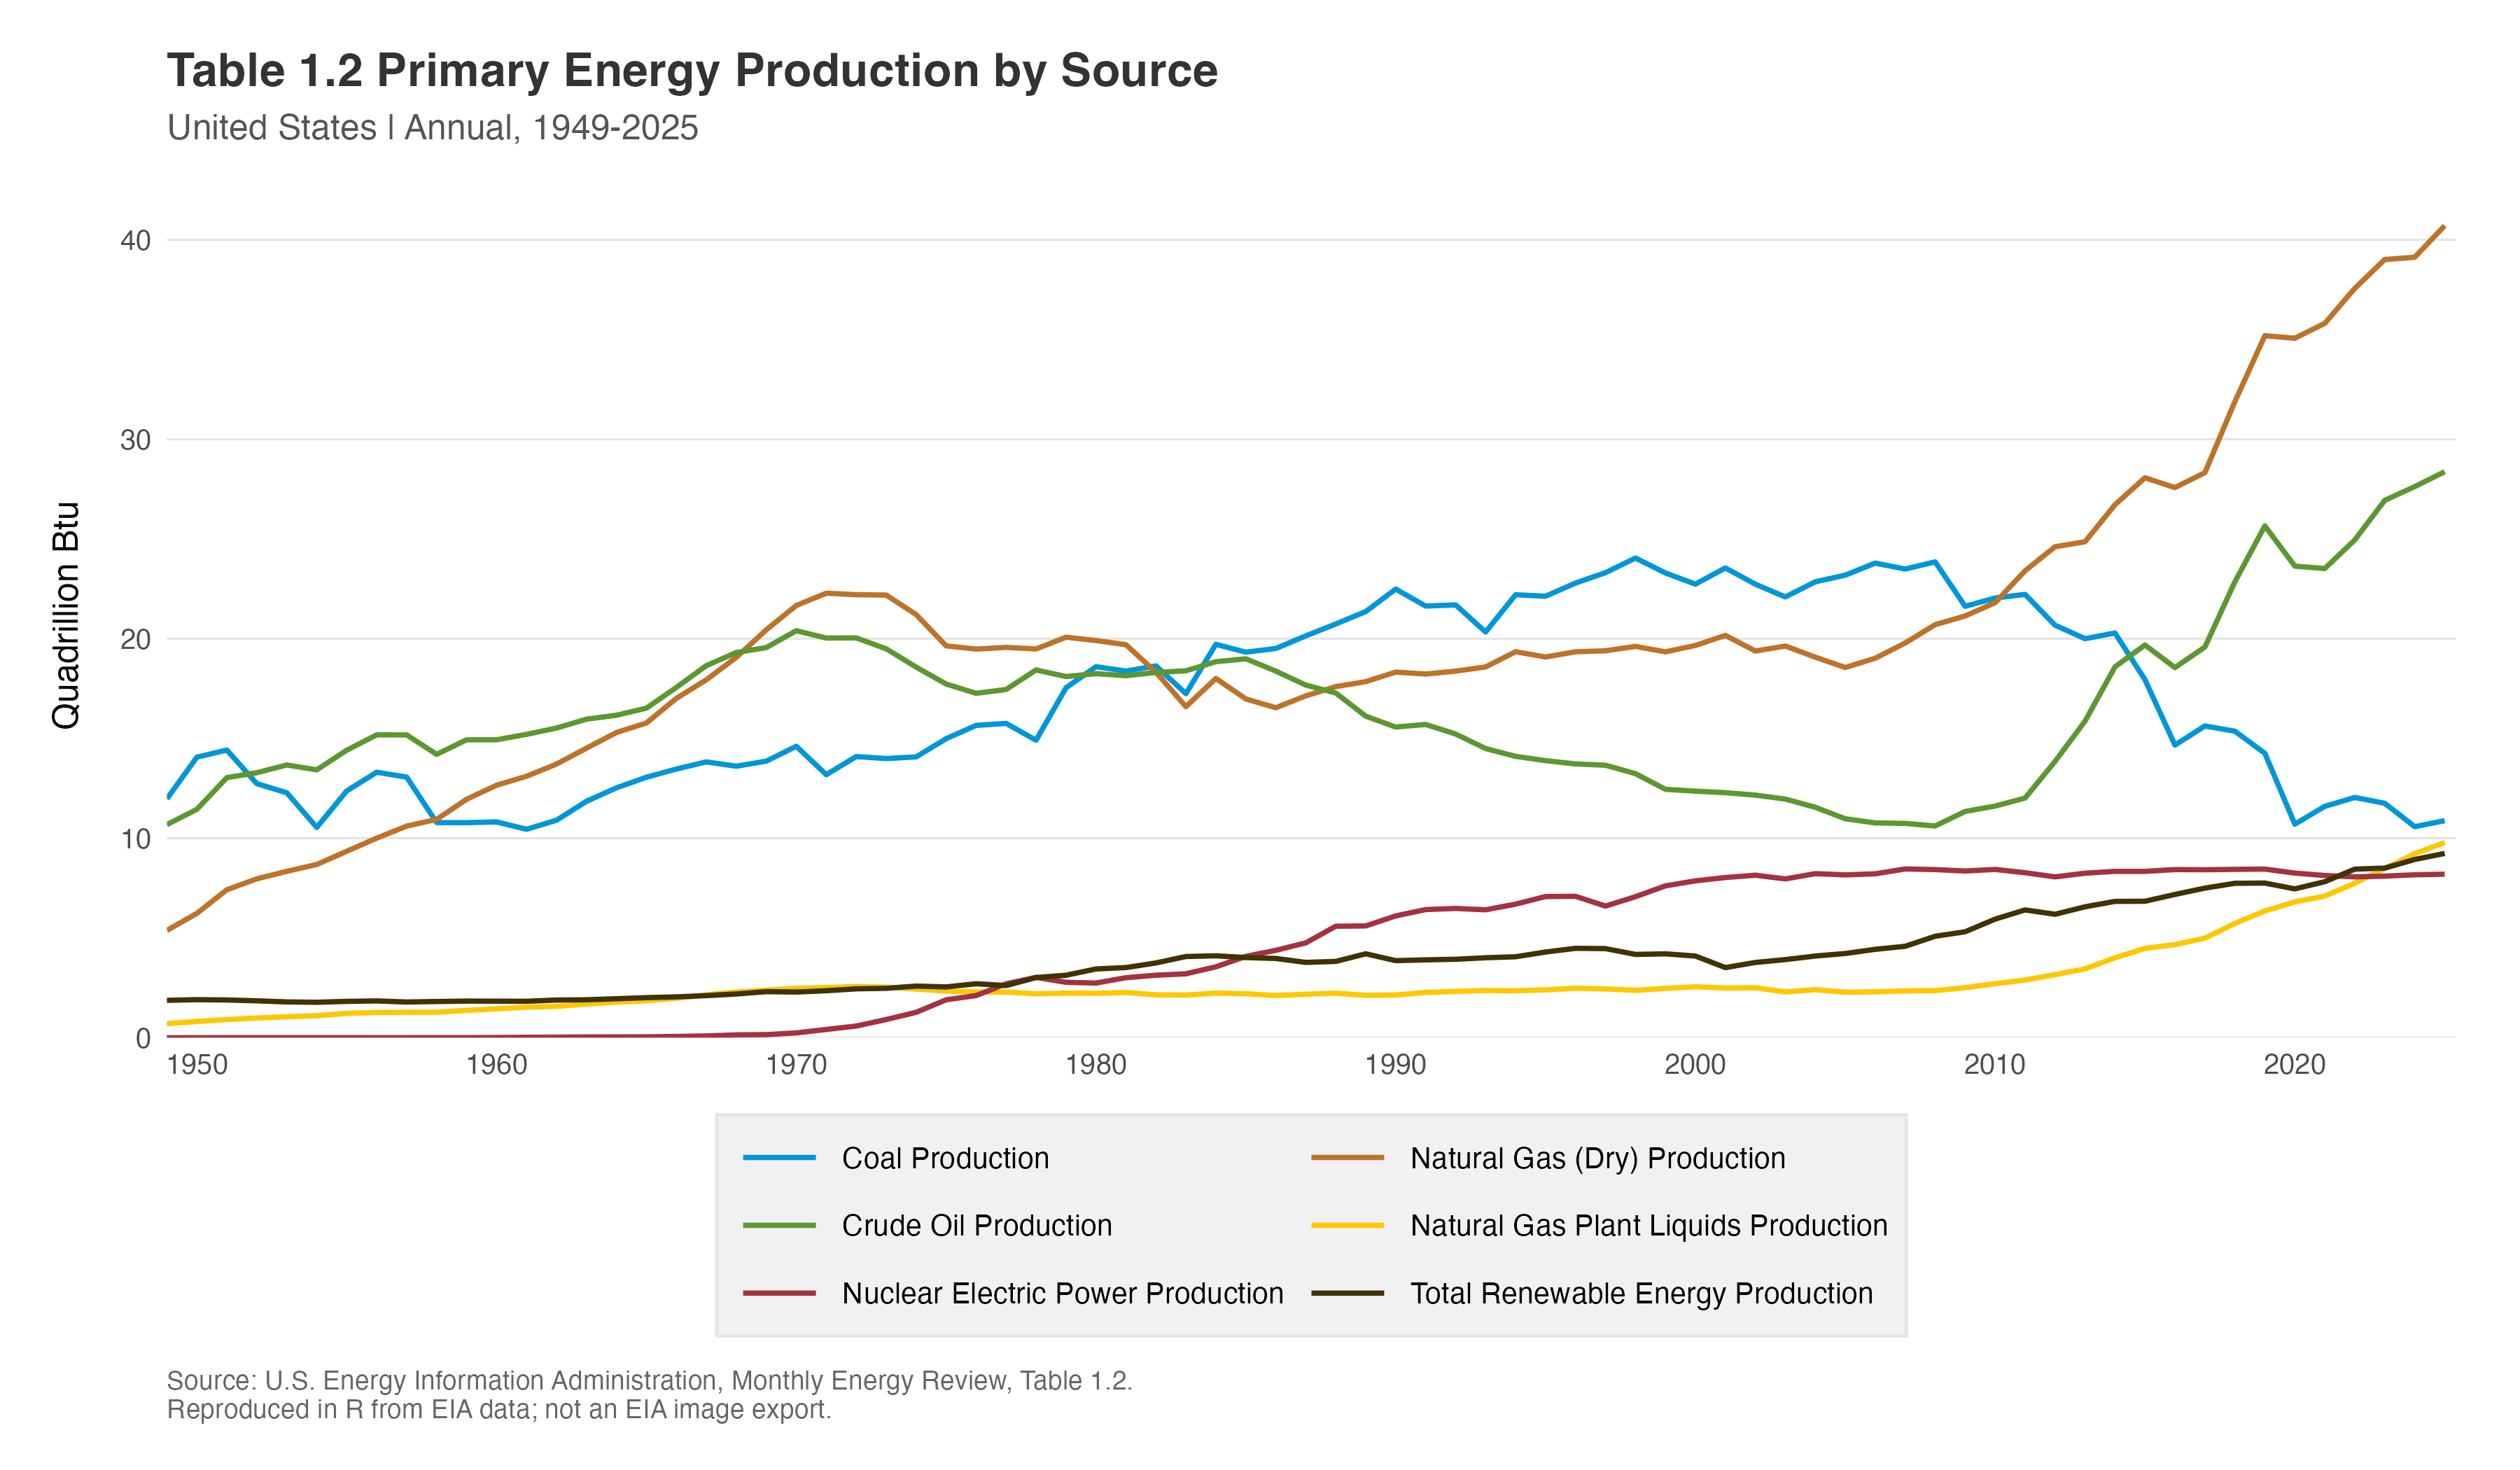
The natural gas production boom in the US that started around 2007 was enabled by a series of technological innovations – most notably horizontal drilling and hydraulic fracturing – that allowed gas extraction from unconventional sources like shale rock formations. Unconventional source gas production shares many important characteristics with green energy technology. Just like solar and wind are substitutes for fossil fuel-based electricity production, natural gas is an imperfect substitute for other energy commodities like oil and coal (see this EIA chart comparing production and consumption of different power sources). Solar and wind electricity production involves relatively high up-front capital costs, and a natural gas well that uses horizontal drilling and fracking can be 3 times more expensive to build compared to a traditional well. Just like solar and wind are the relatively immature technologies compared to other sources of electricity, natural gas from unconventional sources was the much less developed technology throughout almost all of the 20th century. And unconventional gas production had to solve a bunch of “chicken and egg” problems including a lack of pipeline infrastructure connecting shale gas fields to possible consumers, just like solar and wind need to solve grid interconnection problems or EVs need to solve charging station infrastructure problems.
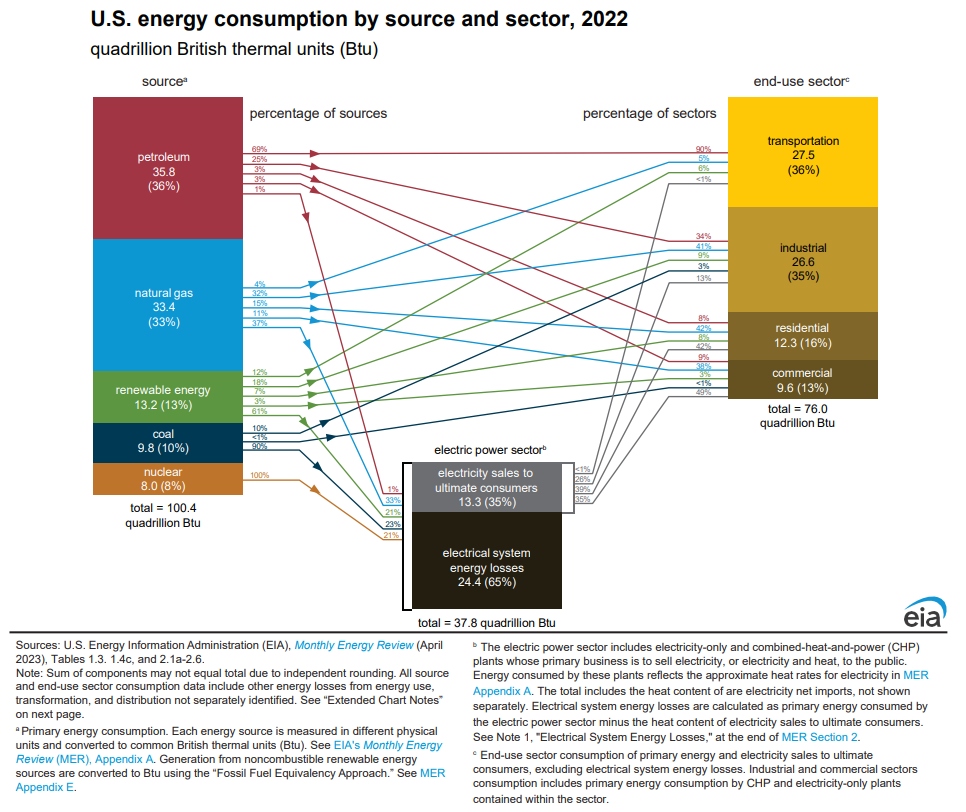
So why did unconventional source natural gas production become such a dominant source of energy production in the US? And does the explanation match up with the channels identified by the directed technical change literature?1
Market size
The evolution of the size of the market for natural gas has clearly been toward a larger and larger market over recent decades. Throughout much of the 1900s regulation and resulting lack of pipeline infrastructure impeded the sale of natural gas across state borders. This reduced incentives for natural gas production in places like Texas that have abundant deposits but are far from the major natural gas demand centers in the Northeast (Golden and Wiseman 2015, pg. 978-981). Deregulation starting in the 1980s and progressing into the 1990s removed these impediments. Relatedly, multiple policy levers were pulled to expand pipeline capacity including the use of imminent domain and changes to regulations requiring pipeline operators to carry gas. The added pipeline capacity allowed deregulated natural gas producers to reach newly unlocked markets.
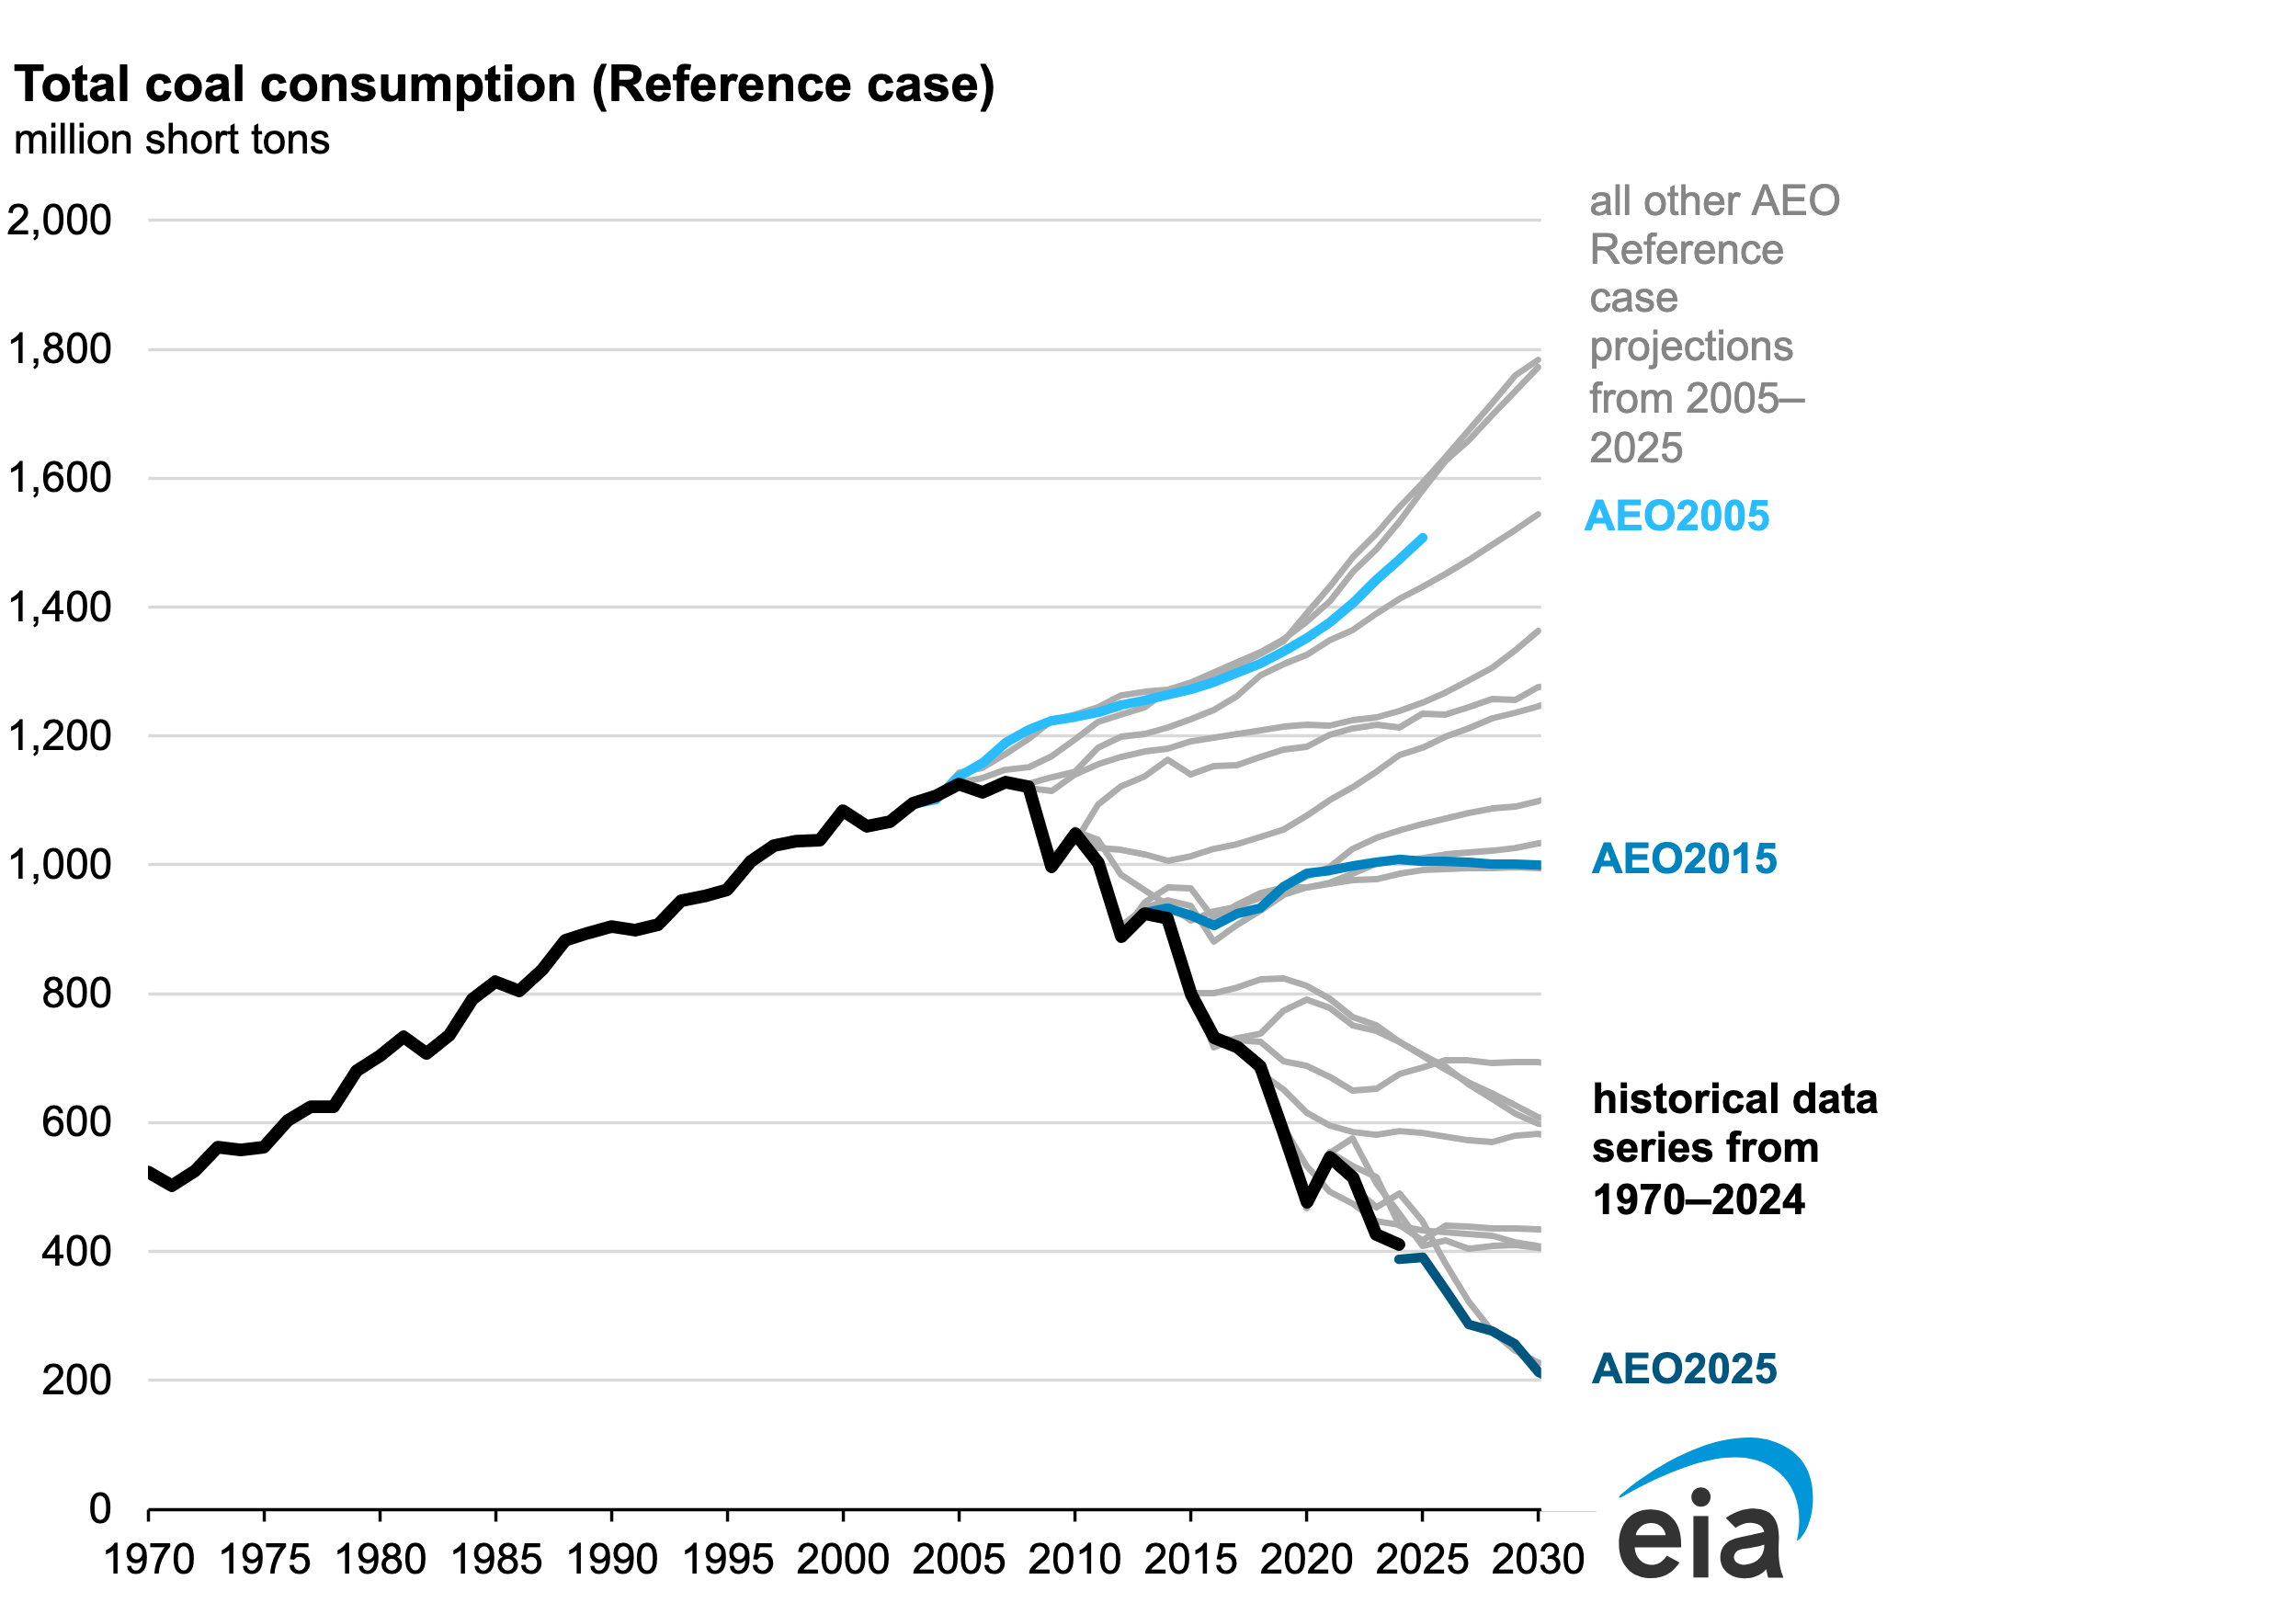
The important element for the theory, though, is how expectations of the relative market size evolved for gas and substitutes like coal and oil. Like natural gas, coal producers in the western US were also the beneficiaries of deregulation, especially related to rail transport (a history that environmental economists are familiar with because of the effect it had on sulfur dioxide emissions, see Schmalensee and Stavins 2013). In recent years, demand for coal in the electricity generation sector has fallen precipitously, but this can be misleading when applying the theory because a lot of this fall is due to the incredible rise in natural gas production. Back in 2005 or 2006, was the expectation that coal demand would fall? No. EIA’s projections showed a steady, on-trend increase in demand (see figure below).2 The EIA Annual Energy Outlook I have on hand does not include natural gas consumption projections, so I cannot do an apples-to-apples comparison, but given that natural gas markets had expanded dramatically in the 1990s, I will say this element likely favors the theory. People might have reasonably believed that natural gas market size would increase faster than coal market size. This become especially plausible if we consider pollution policies like the Acid Rain Program that were largely aimed at coal-based electricity production.
Oil is of course a well-integrated, global market with consistently high demand from a wide range of economic sectors. Thus, I do not expect that industry participants foresaw a large relative change in demand for the sector compared to the major institutional and physical constraint changes that unlocked new markets and demand for natural gas. The oil market is huge and until very recently natural gas producers could still not expect to be able to easily reach international markets, so if we take the theory literally, I have to assume that $L_{\text{gas}}/L_{\text{oil}} < 1$, but I can believe that market participants viewed this ratio as moving closer to 1 over the 1990s and early 2000s.
Conclusion: Empirical pattern appears to match theory at least directionally. The natural gas market experienced a durable increase in size, and likely an increase in size relative to competitor fuels.
Prices
Looking at the price time series for natural gas, it might seem like the evolution of this factor contradicts the directed technical change model. After peaking then crashing in 2008, prices have remained relatively low. But this ex post view is very different than what market participants were reporting as their beliefs on the eve of the fracking boom. Here’s a quote from an article by Bethany McLean
McClendon [the founder of Chesapeake Energy, a firm central to the unconventional source natural gas boom] had by [the early 2000s] convinced himself that natural gas prices would never fall. In August 2008, he predicted that prices would stay in the $8-$9 range for the foreseeable future. “He had a very, very strong point of view about gas,” said one banker who knew him since the early 1990s. … McClendon’s bullish view on prices became the conventional wisdom in energy markets. In 2007, the supposedly smartest investors in the world – among them Goldman Sachs and the takeover titan KKR – structured their massive $45bn buyout of a utility called TXU in a way that was essentially a bet that natural gas prices, then around $7, were set to rise significantly.3
EIA projections from the mid to late 2000s shared some of McClendon’s and investment firms’ optimism. They indicated mean reversion in the late 2000s but still for prices to stay at a relatively elevated level.

There were institutional reasons to believe that natural gas prices would be durably elevated compared to their historical levels, coming from some of the same sources as the increase in market size discussed above: “By the early 1990s, the foundations for a vibrant national market in natural gas—open-access interstate pipelines and favorable policies on pricing—were in place” (Golden and Wiseman 2015 pg. 983).
Prices for coal fell dramatically in the years leading up to the natural gas boom. Coal prices fell steadily by more than 50% between 1980 and 2005, and in 2005, EIA projected that prices would stabilize but remain at that historically low level. Through the late 1980s, 1990s, and early 2000s, crude oil prices were relatively low and stable (source). For whatever reason, I cannot find the EIA projections from the 2005 AEO for crude prices.

Conclusion:* Very clearly in favor of the theory. Industry actors, financial firms, and the EIA thought that natural gas prices would be relatively high compared to substitutes.
Productivity of the research process
This factor is a little harder to assess empirically. We want to know how big the research base was over time for unconventional natural gas versus competitor products. The academic literature often uses patents to study this question, but for fracking and horizontal drilling in particular, important industry players chose not to patent for one reason or another, making that an unsuitable measure (Golden and Wiseman pg. 1000).
But we do know that consistent public and public-private support for research was an important precursor to the natural gas boom:
The U.S. government funded or performed both basic and applied research that helped prime the pump for the ultimate shale gas boom. Energy crises of the early and mid-1970s prompted Congress and President Ford to create the Energy Research and Development Administration (ERDA) in 1976, with promotion of “Unconventional Gas Research” as one of its goals. … For our purposes, perhaps the most important program initiated by ERDA was the Eastern Gas Shales Program (EGSP), which ERDA launched in 1976 and the DOE sustained until 1992. … The amounts spent by the EGSP were modest in the context of overall spending of tens of billions of dollars by industry and government on energy-related research and development. But the EGSP’s contributions came at critical times when the possibilities for exploitation of shale gas reserves were poorly understood, when large oil and gas companies were reducing investment in research and development, and when, as has continued to be the case, the field of unconventional gas recovery was largely dominated by relatively small independents with limited budgets for research and development. (Golden and Wiseman 2015, pgs. 983-985)
Government-funded research programs helped develop the technology of horizontal drilling, hydraulic fracturing, new drill bits that enabled faster and cheaper directional drilling, data monitoring tools to help determine when drilling had entered the often narrow shale gas formations, and 3D seismic imaging.
Conclusion: I do not have a clear indication of the relative research base for unconventional gas versus other energy sources, but again, the level of research support clearly grew during the 20th century. And the quote from Golden and Wiseman indicates that this support might have been right at the time when R&D in the oil and traditional gas sectors was stagnating.
Other factors
Beyond the factors identified by directed technical change models, there are other factors I have seen noted by commenters or researchers.
Animal spirits
Or vibes, as the kids might say. Many accounts of the fracking boom focus on the single mindedness and force of personality of folks like George Mitchel or Aubrey McClendon. Modern economic research on technical change tends to downplay the role of individual, self-motivated people and instead focus on the financial incentives that researchers face. Although I am an economist, I do find something to the vibes-based explanation both for the natural gas boom and for the difficulties faced by some green investments. If you are looking to finance a natural gas project, maybe the skids are a little more greased in the US.
Certainty
Golden and Wiseman repeatedly emphasize the importance of certainty, both in R&D funding from sources like the Gas Research Institute (pg. 986), and for the final producers of natural gas like Mitchel Energy’s long-term contract to supply Natural Gas Pipeline of America (pg. 976). This agrees with economics research, including by my student Clara Berestycki, finding that policy uncertainty is an important impediment to energy R&D and investment.
Capital financing
Directed technical change models emphasize demand-side factors. But supply-side factors – especially the need to finance relatively capital-intensive projects – are often discussed as a constraint to growth in renewables. The same is true of natural gas production with hydraulically fractured, horizontally drilled natural gas wells, which as noted above can cost 3 times that of a conventional well. Thus, commentators do not view it as a coincidence that the natural gas boom occurred at the same time as low interest rates post 2008 financial crisis (see, for instance, the quote from Amir Azar here).4
Costs of production and tax treatment
Similarly, policy changes helped reduce the cost of natural gas production (which if markets are competitive should really have an effect on the direction of technical change, but there are lots of fixed costs here, so I suspect it did play a role).
[The] Energy Policy Act of 2005 … exempted natural gas drillers from having to disclose the chemicals used in hydraulic fracturing, thus averting costly regulatory oversight.
And small natural gas producers were subject to preferential tax treatment through the “percentage depletion allowance,” Section 29 tax credits, and other tax deductions.
Property rights
US private landholders own the rights to the minerals under the land, creating the opportunity for relatively small-scale natural gas producers to enter the market by leasing or purchasing those rights.
Version history
2026-11-10: First version
-
Much of the discussion below comes from my reading of Golden and Wiseman (2015) “The Fracking Revolution: Shale Gas as a Case Study in Innovation Policy.” In some sense, you can think of this post as just reclassifying the evidence from that law review article to see how it does or does not match up with the directed technical change framework from economics. ↩
-
Though this is only domestic consumption. International demand might have been expected to evolve differently. ↩
-
The whole article is full of fascinating quotes. On the same topic of price expectations, there this: “’Simply put, low prices cure low prices as consumers are motivated to consume more and producers are compelled to produce less,’ he wrote in Chesapeake’s 1998 annual report. But he had forgotten the flipside of that industry truism. Time and again, in commodity markets, high prices encourage more producers to produce, creating a surplus, that then crushes prices – and producers.” ↩
-
Though I’ll note that this story does not quite make sense to me. The investments clearly started before 2008, and during the crisis, credit markets were “frozen” for many borrowers (I was at the Fed at the time and worked specifically on programs aiming to unfreeze interbank lending). ↩