Running weather regressions and using clustered standard errors? I have a modest proposal: cluster at the National Weather Service (NWS) County Warning Area (CWA) level.
Below I discuss why one might want to do this. If you just want to try it out right away, you can download my county FIPS to CWA crosswalk here (csv format, so leading zeros on FIPS codes have been eaten) or download the NWS’s CWA shapefile here
What are CWAs?
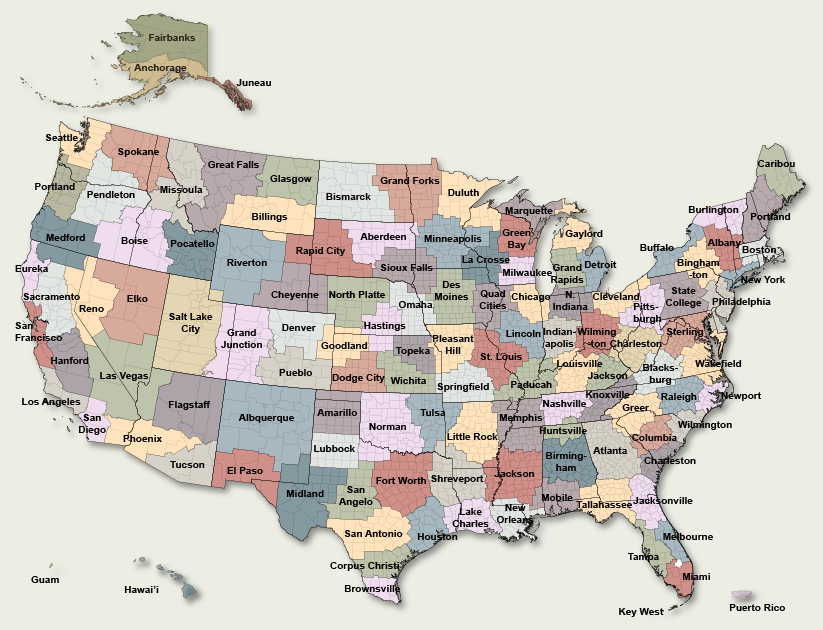
The NWS runs a 122 Weather Forecasting Offices (WFOs – I swear this is the last 3-word acronym) across the U.S. Meteorologists in each of these offices are in charge of generating and disseminating forecasts, watches, and warnings for the area around their office, the CWA. CWA boundaries are almost always based on county boundaries, and you can see the current (as of 2025) CWA map below with labels for the location of the WFO. This map comes from NOAA.
Why cluster weather regressions at the CWA level?
In brief, CWAs balance ease of implementation and adherence to econometric goals. On the ease of implementation side, CWAs are exhaustive and (nearly) mutually exclusive collections of counties. Given the prevalence of county-level data used in studies of climate and weather effects in the U.S., it is easy to add CWA clustering to many existing analyses.
On the econometric side, CWA clustering has advantages relative to clustering at the county or state level. Counties are so small that economic and weather activity plausibly spill over across locations (see the post on temperature autocorrelation). This is similar to the reason why commuting zones are also a better level of clustering than counties in many cases. For analysis of weather forecasts in particular, as in Fatal Errors, the CWA is also the level at which treatment is determined given that each WFO generates its own forecast. So clustering at the CWA level follows standard advice on how to determine the appropriate cluster level.
State clustering likely does a better job than county clustering when it comes to autocorrelation issues, but with states one runs into the issue of a relatively small number of clusters. For continental U.S. analyses, one had a maximum of 48 or 49 clusters, below the sometimes recommended minimum of 50. There are 116 CWAs in the continental U.S. States are also wildly different sizes. CWAs are more comparable in size, and their borders are more likely than state borders to be determined in part by climatological similarity, helping with the plausibility of the clustering assumption.
How to do it
You can download my county FIPS to CWA crosswalk here (.csv) or here (.rds). The R code I used to generate the crosswalk is here.
You can download the NWS’s CWA shapefile here.
Version history
2025-07-27: First version